
Running GLM-5.3 on Two 8-GPU AMD W7900D Machines
This may be the lowest-cost setup for a genuinely usable GLM-5.3 deployment.
Sixteen GPUs, 768 GiB of total VRAM—and GLM-5.3 initially generated just 4.08 tokens/s, taking roughly 245 milliseconds per token.
Having enough memory to fit the model does not make compute scale automatically. Each of our two machines has eight 48 GiB W7900D cards. Communication uses PCIe 4.0 within a node and TCP between nodes, with no XGMI high-speed interconnect available to this execution path. The model has to span multiple GPUs, but every additional collaboration point can add another wait to each token.
This constraint shaped our ROCm optimization work in zLLM: reduce communication inside layers, improve the work performed on each GPU, then use MTP speculative decoding to reduce the number of full-model execution rounds.
Checking the original result files on Amd-1 gives 11.321 tokens/s for a complete run with one GPU per stage and MTP disabled. The latest two-GPU operator-pair version achieved 13.842–14.043 tokens/s across three runs, with a median of 13.968—about 14 tokens/s. The single-GPU-stage path is about 2.77 times faster than the initial 4.08 tokens/s baseline.
A complete run of an older paired version with MTP also recorded 25.275 tokens/s. This establishes that the combination has been tested; it does not establish that MTP has been validated on the latest version delivering approximately 14 tokens/s without it.
Measurement notes: the main results come from JSON files and runtime logs on Amd-1. The corpus is named
50k-allgpu.txt, but the actual requests contained 46,152–46,158 input tokens and generated 1,024 tokens each. Decode throughput is the remaining 1,023 generated tokens divided by generation time after the first text event. “50K” below retains the corpus name; 50K in operator profiles describes their workload size. Results with different commits, nonces, or MTP settings are not strict same-version A/B comparisons.
Decide where data lives before deciding how to parallelize
Single-request autoregressive generation has a hard dependency: the next token must wait for the current token to finish sampling.
For the 78-layer model tested here, a token passes through every layer, the final output projection (LM Head), and sampling before the next round can begin. Distributing those layers across 16 GPUs divides the execution chain into stages. It does not let one token pass through all layers simultaneously.
We started by assigning each GPU a contiguous range of complete layers. Weights, KV cache, sparse-attention index state, expert weights, and scratch buffers remain local. Only the hidden activation at a stage boundary needs to be handed off:
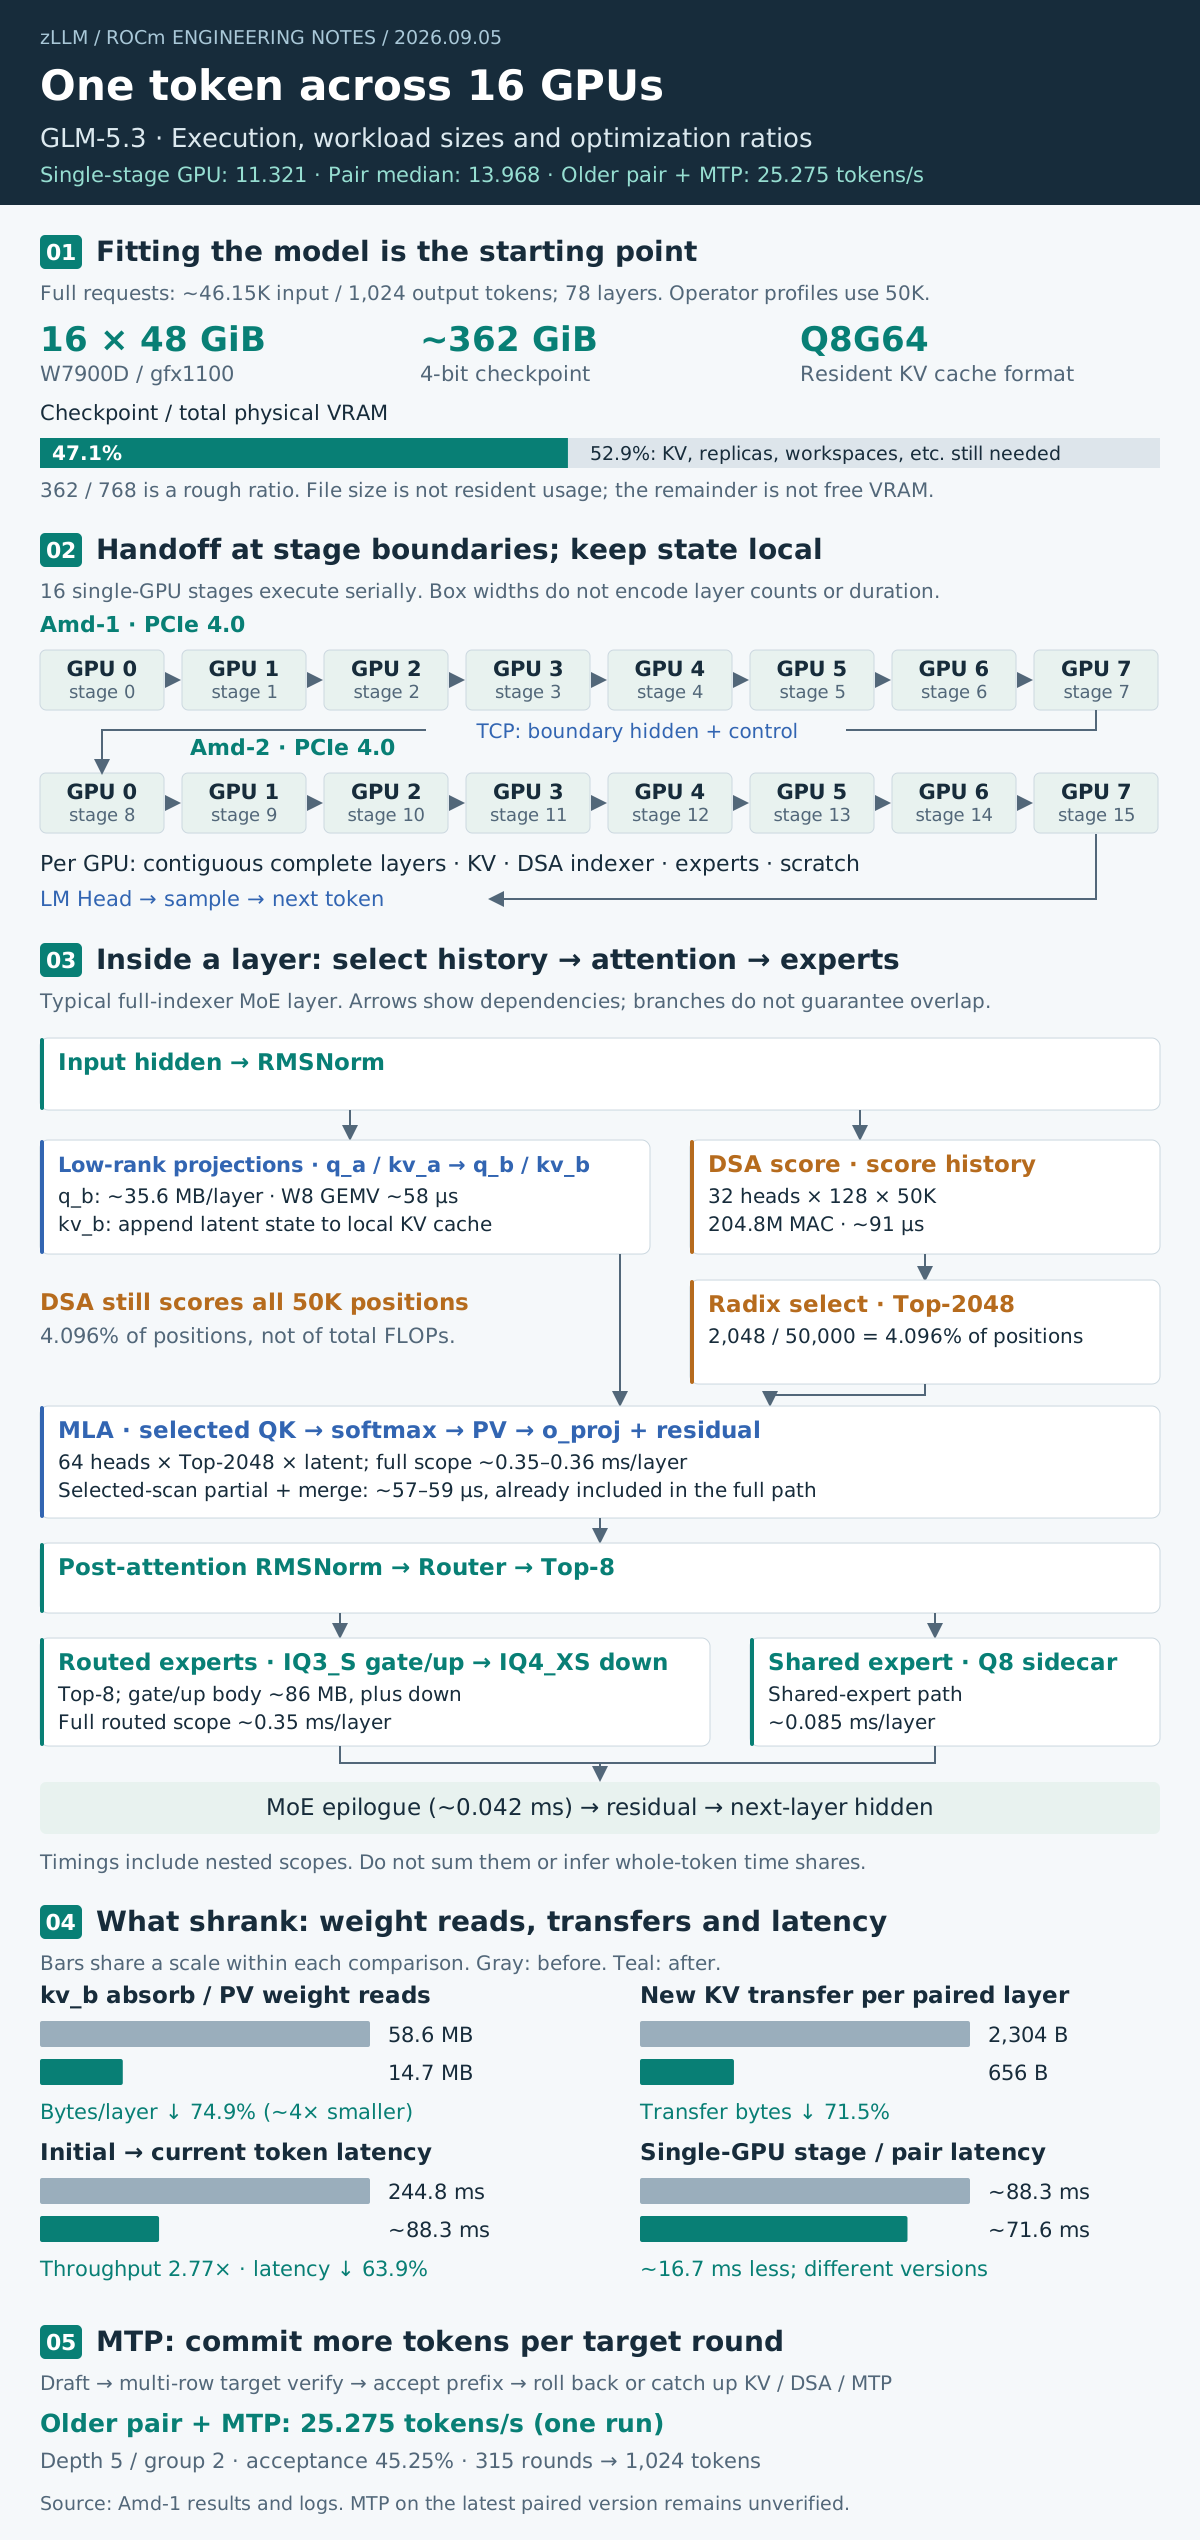
Click to enlarge. Traffic and latency comparisons have separate scales. Layer profiles contain nested scopes and must not be added up into a whole-token time breakdown.
“Single-GPU stage” means one GPU executes each stage; the complete model still uses all 16 GPUs.
An earlier design used finer-grained collaboration between two GPUs, repeatedly exchanging queries, selections, and expert partial results—four to six handoffs per layer. The tensors were not necessarily large, but event waits after each exchange put the difference in GPU progress onto the critical path. Across 78 layers, coordination costs absorbed the savings from parallel computation.
The approximate latency budget for single-request decode is therefore:
Per-token latency
  ≈ sum of serial execution time across all stages
  + stage handoffs
  + LM Head, sampling, and the autoregressive return path
This distinction also matters for load balancing. When multiple requests or prefill chunks overlap, the slowest stage limits pipeline throughput. For single-request, token-by-token decode, total chain time comes first. Moving layer boundaries helps only if it reduces waits, improves execution efficiency, or relieves resource constraints.
From 4.08 to 11.32: where the time went
The archived tests used GLM-5.3 UD-IQ4_XS GGUF, 78 layers, Q8G64 KV, the “50K” corpus—actually about 46.15K input tokens—and 1,024 generated tokens. MTP, DSpark, and the old cooperative-pair path were disabled.
| Stage | Decode (tokens/s) | Latency per token | Main changes |
|---|---|---|---|
| Initial single pipeline | 4.084 | 244.8 ms | Topology corrected; single-row operators still unoptimized |
| One GPU per stage, no intra-layer pairing | 11.321 | About 88.3 ms | Dedicated IQ kernels, MLA tuning, Q8 shared expert, direct W8 reads, scheduling improvements |
At 11.321 tokens/s, throughput is about 2.77 times the initial baseline and per-token latency is about 63.9% lower. Several changes account for the improvement.
A single decode row is not a large matrix multiplication
Prefill processes multiple input rows, allowing matrix multiplication to amortize weight reads. Ordinary decode processes one row at a time. It is closer to matrix-vector multiplication, or GEMV: a large set of weights is read to produce one token's output.
Weight traffic, dequantization instructions, thread mapping, and kernel launch overhead become prominent. We wrote HIP/ROCm operators specifically for gfx1100, with dedicated paths for IQ3_S, IQ4_XS, and Q8/W8A16.
For example, IQ3_S gate/up uses an 8-lane subgroup, followed by wider u16 loads to reduce loading overhead. With layout and output bit patterns unchanged, probe time fell from approximately 207–211 microseconds to 188–190 microseconds.
Similar code does not guarantee similar gains. IQ4_XS down already achieved about 465 GB/s of effective bandwidth. Porting a different codebook-reading implementation increased its time from 102 to 144 microseconds. For this shape, further work on codebook caching did not address the main bottleneck.
Keep quantized weights compressed in memory
Multi-head Latent Attention, or MLA, is a major aggregate hotspot executed in every layer. The resident representation of kv_b was wasting substantial bandwidth.
The old path decoded W8 weights into F16 and then kept a dense F32 representation resident for absorb/PV operations. Although the stored weights were quantized, execution expanded them again: those stages read approximately 58.6 MB per layer.
The new path consumes W8 weights and scales directly, reducing traffic to about 14.7 MB, roughly one quarter of the original. Complete runs improved from about 9.76 to 10.50/10.28 tokens/s, an average gain of roughly 6.5% across the two runs.
This was more direct than another tile adjustment: if the hot path ultimately reads F32, quantization has saved file size without fully delivering its runtime bandwidth advantage.
Other MLA changes also helped. Vectorizing contiguous PV loads reduced the device scope from approximately 0.484 to 0.439 ms/layer, yielding about 2.5%–3.5% for the full model. Selected scan distributed QK work previously handled mainly by one wave across eight waves, cutting partial-plus-merge time from approximately 90.6 to 57–59 microseconds.
These local savings do not automatically translate into equal reductions in token latency.
A faster kernel can still leave the full chain slower
The DSA sparse-attention indexer selects historical positions for subsequent attention computation. At a 50K workload, score computation took about 91 microseconds, already reaching roughly 68% of the profile's estimated compute ceiling. The serial tail of radix selection was a more promising target.
The original last two levels rescanned serially in one thread block. Splitting the work into multiple kernels reduced the relevant kernel time from about 105 to 96 microseconds. But two additional launches, each costing about 12 microseconds, left complete selection at approximately 139 microseconds. The expected end-to-end gain did not materialize.
These experiments expanded our unit of optimization: first a kernel, then an entire operator, and ultimately a stage's contribution to the token critical path.
| Main constraint | Examples | Useful direction |
|---|---|---|
| Weight-read bandwidth | q_b, kv_b, MoE weight streams | Compressed residency, wide contiguous loads, shared weight reads |
| Compute and dequantization instructions | DSA score, IQ decoding | Wave mapping, shorter instruction dependencies |
| Synchronization and scheduling | Multi-level radix selection, launches, pair joins | Fewer handoffs, fused dependency chains, no bridge copies |
The updated source notes provide the following bandwidth breakdown:
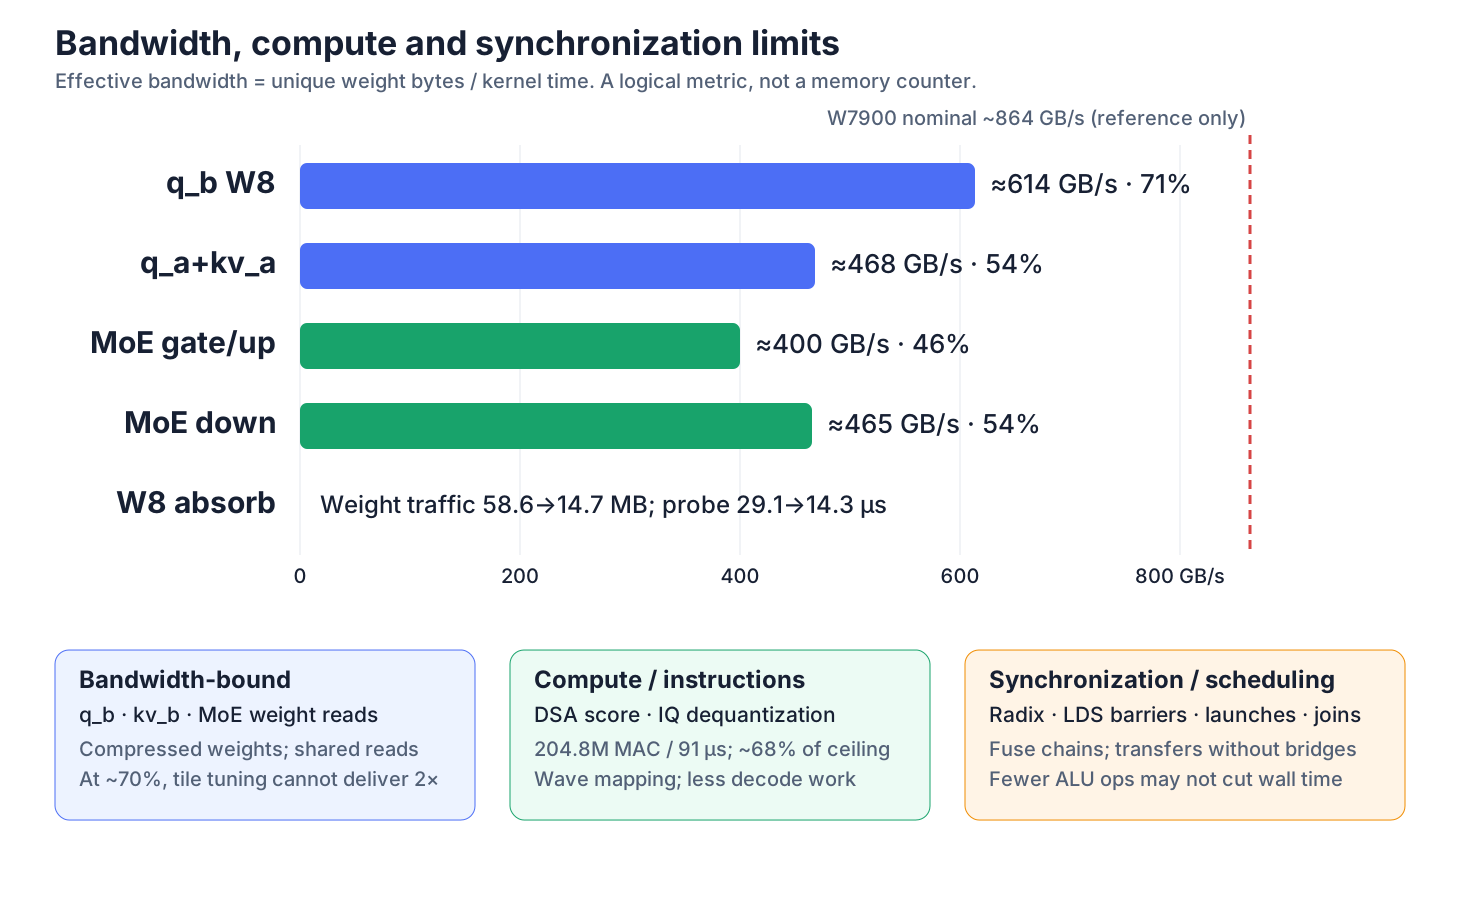
Effective bandwidth here is weight bytes divided by kernel time. It is an analytical metric. Usable underlying memory-traffic and occupancy counters were not available in this investigation, so these values are not hardware-counter measurements.
The Graph experiment: faster launches, but 4%–5% lower throughput
HIP Graph records a repeated kernel dependency chain and replays it, reducing the cost of submitting kernels individually. This looks attractive for single-row decode with many short kernels. Our probes confirmed launch savings, but integrating the graph into the production path did not deliver an end-to-end gain.
The probe improved; the complete request did not
A chain of 64 small kernels took approximately 0.76–0.80 ms on the eager device timeline, compared with 0.23–0.27 ms for warmed static Graph replay. That is roughly 12 versus 4 microseconds per node. Graph reduced dispatch gaps; it did not accelerate the computation or weight reads inside each kernel.
After correctness fixes, complete-request tests of the five-node MoE Graph produced:
| Same binary, “50K” corpus, 1,024-token decode | Run 1 | Run 2 |
|---|---|---|
| Graph disabled | 9.509 tokens/s | 9.607 tokens/s |
| Graph enabled | 9.119 tokens/s | 9.124 tokens/s |
| Throughput change | −4.1% | −5.0% |
This was a historical Graph experiment, fixed in b4433700 and recorded in 51a4f30d. These figures describe a same-version Graph toggle comparison. The verified single-GPU-stage result used elsewhere in this article is 11.321 tokens/s. The historical regression percentage must not be applied directly to the latest version.
Why saving launches still lost time
The crucial cost was bridging into fixed addresses. This implementation's graph nodes recorded device pointers, while upstream outputs had to be moved into the graph's fixed slots. That added three device-to-device copies per layer, plus their host submission overhead.
The graph covered only five nodes, limiting the dispatch gaps it could eliminate. The bridge operations, meanwhile, recurred every layer. Applying the per-node probe difference gives only about 40 microseconds of potential savings for five nodes. This is a scale estimate, not the production graph's net benefit. The real budget must include bridging, replay, and subsequent dependency waits; complete-request measurements showed a loss.
The small MoE graph also left the long serial attention chain outside its scope. It did not reduce expert weight reads, dequantization, or inter-GPU waits. It optimized a small part of the critical path while adding fixed costs to enter that part.
Correctness was fixed; the performance problem remained
Earlier versions also suffered hangs, NaNs, and illegal memory accesses. Intermediate buffers used while building the graph were returned to the memory pool when construction finished, but graph nodes retained their device pointers. Once the pool reused those addresses, replay could access another object's memory.
The isolated probe did not reproduce this because it retained its buffers throughout the test. Production execution had a different resource lifetime. The fix made the graph object retain the required buffers, keeping their addresses valid during replay. Additional synchronization temporarily hid symptoms, but long-context tests still failed: synchronization cannot repair a dangling pointer.
The negative results in the table were measured after the fix. Stable replay and lower end-to-end latency require separate validation.
When another attempt is worthwhile
The production path remained at decode_graph=false. A worthwhile next experiment is a whole-layer graph covering a longer dependency chain: upstream operators write directly into fixed workspaces, eliminating extra bridge copies, and the graph explicitly retains its referenced resources. Workspace growth and memory-pool reuse must not invalidate captured pointers.
Even with broader coverage, the final test is a complete request using the same binary, input, and output-correctness requirements, with the profiler disabled. The acceptance metric is token latency—not node count or replay-probe speed.
Why two-GPU parallelism did not come close to doubling speed
After optimizing the single-GPU path, we revisited paired execution. The new parallel_operator_pairs path partitions MLA by query heads and MoE by intermediate dimension, merging results at larger attention and FFN boundaries.
We also changed the exchange format. The owner quantizes KV once, transmitting only newly appended Q8 latent values, scales, and RoPE information. Per-token, per-layer KV exchange fell from 2,304 B to 656 B, a 71.5% reduction. Each side recomputes the router to avoid another routing-table handoff.
The non-MTP results are:
| Execution | Decode (tokens/s) | Latency per token |
|---|---|---|
| One GPU per stage, no intra-layer pairing | 11.321 | About 88.3 ms |
| Two-GPU operator pairs, median of three runs | 13.968, about 14 | About 71.6 ms |
The paired median is approximately 23.4% faster than 11.321 tokens/s, reducing latency by about 16.7 milliseconds per token. This compares different versions, rather than a strict same-version parallelism toggle. Profiles explain why the gain is far below ideal halving.
First, splitting query heads did not split the historical scan. Both GPUs still gathered Top-2048 positions and scanned the complete logical KV. The paired MLA scope took approximately 0.35–0.45 ms/layer versus 0.35–0.36 ms/layer on one GPU, providing essentially no speedup.
Second, splitting large weight operations did not halve the entire dependency chain. Norms, routing, DSA selection, some shared-expert work, and merges remained. The complete FFN/MoE section became only about 30%–40% faster.
Finally, attention and MoE each exchanged partial results in both directions every layer. Peer-copy kernels alone totaled about 3.8 ms/token across 78 layers, with additional costs from events, joins, and unequal progress.
These bottlenecks come from profiles of an earlier paired version. They explain the optimization direction, not the exact breakdown of the latest da1e40be version. In those profiles, raw inter-node TCP transmission took only tens of microseconds per token. Most losses arose from layer-by-layer collaboration within a node. Reducing message size alone was insufficient; duplicate scans and synchronization waits mattered more.
Amdahl's law limits overall acceleration when serial work remains, and added communication further reduces the gain. Two busy GPUs do not imply that the token critical path has been cut in half.
Further work aims to make the owner hold the canonical hidden state, reduce partials toward it in one direction, and remove reverse exchanges and duplicate residual work. Partitioning DSA/MLA across history would then allow the GPUs to scan different portions of that history. The next performance step requires changing the division of data and work.
MTP saves full-model execution rounds
Once ordinary decode reaches about 88.3 milliseconds per token, shaving off a few more microseconds has diminishing returns. MTP takes another approach: propose several candidate tokens, then verify them with the target model so that one expensive verification round can commit several valid tokens.
Autoregressive semantics remain intact. Candidate prefixes turn some sequential work into multi-row verification. The benefit depends on accepted tokens per round and the combined cost of drafting, verification, rollback, and state catch-up.
Amd-1's paired-mtp5-g2-50k-d1024-r1.json records an actual paired-plus-MTP run: 46,152 input tokens, 1,024 output tokens, 40.475 seconds of decode, and 25.275 tokens/s. The configuration uses parallel_operator_pairs=true, draft depth 5, and verify group rows 2. Runtime logs confirm that MTP L78 also uses an operator pair.
The corresponding complete-request log records 315 target rounds, 1,567 verified candidates, and 709 accepted candidates, for a 45.25% acceptance rate. That is approximately 3.25 committed tokens per target round under the log's accounting, or 1,024 / 315. Accepted counts by draft depth were 241, 179, 130, 92, and 67, showing declining useful output at deeper candidate positions.
Other complete runs on the same general path reached 23.793 tokens/s with depth 3 / group 2, and 20.647 tokens/s with depth 5 / group 1. Verification organization affects end-to-end behavior, but because settings and request nonces differ, we do not attribute the entire difference to one factor.
25.275 is one complete measurement of an older paired configuration. It is neither a result for MTP on the latest da1e40be paired version nor a stable multi-run baseline. The 1,024-token request completed before a later rocprof-attached diagnostic run appeared in the log. We do not mix those profiler results into this throughput figure. The latest paired version still requires separate validation of MTP speed and correctness.
The next priority is not simply increasing draft depth. Multi-row verification should share weight reads across projections, MLA, and MoE. The cheaper each extra verification row becomes, the more valuable additional accepted candidates are.
Correctness must include state. After a mismatch, target KV, DSA selection, and MTP caches must return to the correct position. After accepting a prefix, the corresponding caches must catch up. Throughput is meaningful only when these states remain consistent.
Why 4-bit today: room for 5/6-bit, but not FP8
We currently choose 4-bit quantization to preserve VRAM headroom for long contexts, MTP, and multi-GPU execution. Four bits is the starting point for this deployment; five or six bits are possible upgrades. Our assessment of this execution path is that they can improve model quality noticeably with essentially no performance loss. For quality-sensitive use, that is more attractive than pushing weight precision lower.
Increasing bit width does not increase end-to-end time proportionally. Single-request decode also includes DSA, attention, kernel submission, inter-GPU synchronization, and sampling. Low-bit formats themselves incur codebook, scale, sign-handling, and dequantization costs. More weight traffic at 5/6-bit therefore does not directly imply the same percentage increase in token latency. This assessment applies to this model, hardware, and execution path; this article does not present separate 5/6-bit speed or quality measurements.
FP8 crosses a different boundary: the current hardware cannot meet the memory budget of the complete deployment described here. The high-quality 4-bit checkpoint is approximately 362 GiB. Roughly doubling weight storage gives about 724 GiB at 8-bit, against 768 GiB of physical VRAM across all 16 GPUs. The remaining approximately 44 GiB must hold long-context KV, DSA state, MTP, peer replicas, workspaces, HIP runtime allocations, and fragmentation. That is insufficient for this deployment. This is a capacity-and-headroom conclusion, not a claim that an API cannot express FP8.
| Weight format | Choice and assessment for this project |
|---|---|
| 4-bit | Current path; preserves context and execution headroom |
| 5/6-bit | Possible upgrade with little expected performance loss and noticeable quality gains on this path; requires recalculating memory headroom |
| FP8 | Current hardware cannot meet the full deployment's VRAM budget |
Execution does not require every tensor to use the same bit width. Routed experts currently use IQ3_S/IQ4_XS, suitable projections retain W8A16, KV uses Q8G64, and LM Head uses Q8G128. A precision upgrade should still choose formats per operator and validate quality on the intended tasks.
Whether using four, five, or six bits, the hot path should consume compressed weights directly instead of keeping an expanded F32 representation resident. Additional memory should improve model quality, rather than pay for unnecessary intermediate representations.
Keep measuring complete requests
A historical cooperative prefill path has an archived 1331.62 tokens/s result under the 50K test setting. It is a different execution configuration and must not be combined with current decode figures as if they came from one run. The next goal is to complete multi-row operators and improve chunk and stage scheduling toward 1500 tokens/s, validated through complete-prompt time to first token.
For decode, the next step is to revalidate MTP on the latest paired version: check output and cache state first, then measure acceptance, multi-row verification cost, and complete-request throughput across repeated runs. The older configuration's 25.275 tokens/s provides experimental evidence, but 30+ remains a target. Gains from different versions cannot simply be multiplied.
The latest notes also report effective activity above 70% during a GPU's local stage execution window. That does not mean all 16 GPUs sustain 70% utilization throughout single-request decode, and it is not interchangeable with hardware occupancy. Local work is more compact; end-to-end timing still determines whether the user waits less.
We retained direct W8 consumption because it reduces weight reads, and rejected experiments whose better microbenchmarks did not improve the complete chain. The standard remains the same: use a reference to check values and state, use profiling to locate waits, then disable the profiler and measure complete requests with matching inputs and settings.
The path every token must finish is the thing we ultimately have to optimize.
Sources and accounting: algorithms and historical experiments follow the project notes updated on September 5, 2026. Current speeds were cross-checked against original JSON files, configurations, and logs on Amd-1. The complete requests cited below were inspected, not rerun for this article.
| Path / result file | Input tokens | Output tokens | Decode (tokens/s) |
|---|---|---|---|
Single-GPU stage: c343909e-current-routepair-no-mtp-strict1024-r1.json | 46,158 | 1,024 | 11.321 |
Paired: paired-directjoin-da1e40be-formal-no-mtp.json | 46,153 | 1,024 | 14.043 |
Paired recheck: paired-directjoin-da1e40be-formal-recheck-no-mtp.json | 46,153 | 1,024 | 13.842 |
Paired recheck: paired-directjoin-da1e40be-formal-recheck-no-mtp-r2.json | 46,153 | 1,024 | 13.968 |
Older paired + MTP: paired-mtp5-g2-50k-d1024-r1.json | 46,152 | 1,024 | 25.275 |
The files are in /workspace/zllm-kv-eval-run/runs/ and results/ on Amd-1. Their base-corpus SHA-256 matches, while nonces are not all identical. The three latest paired runs have identical output SHA-256 values. This establishes output consistency across those runs, not an independent model-quality evaluation. Some runner topology fields retained a “16 serial stages” template; runtime logs confirm four owner-peer pairs per node, or eight logical stages across both nodes, for paired execution.